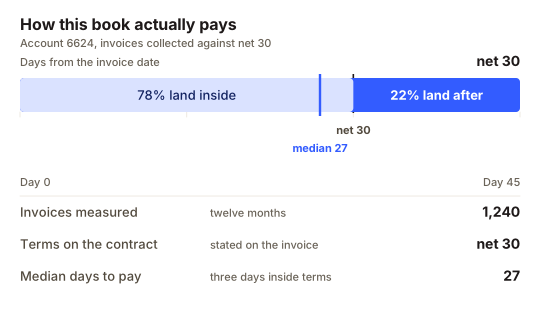
The forecast runs on how you get paid
Collection behaviour is measured from your own history rather than assumed from the due date.
Predictive analytics
Forecasts are built from your own billing history rather than a growth rate typed into a cell, and cash follows how each customer actually pays.
Forecasts run on your own billing history, and cash follows how each customer actually pays.
Use cases
Verlix handles
Collection behaviour is measured from your own history rather than assumed from the due date.
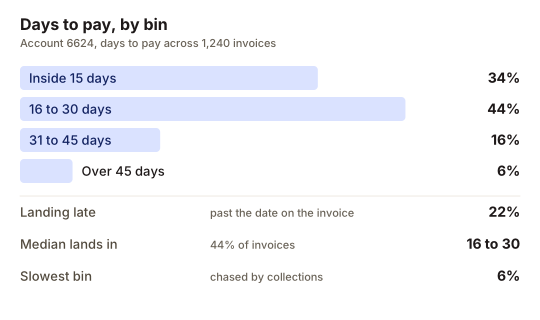
The shape of the book behind the cash line, from invoices that settle in a fortnight to those past 45 days.
Cash flow prediction · accuracy
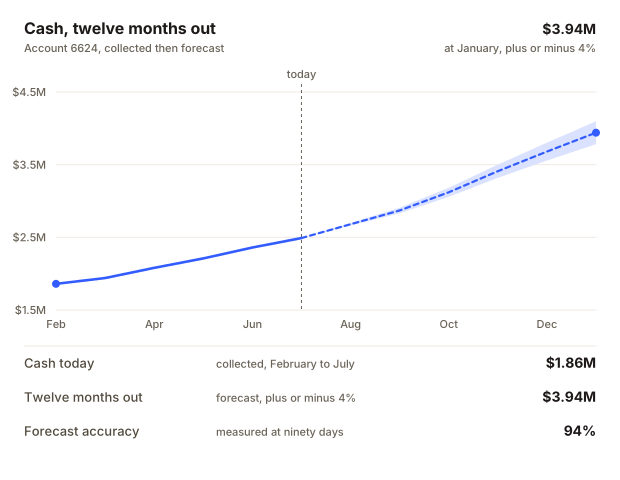
Every month's forecast is kept and scored against what actually landed. February to July averaged 94 per cent at ninety days, which is the number to take to a board rather than the one that flatters.
Each month is scored against the forecast made ninety days before it, not against a revision made closer to the date.
Actually collected against the forecast made ninety days earlier: rose from 1.9M at Feb to 2.5M at Jul across 6 points; range 1.9M to 2.5M.
Cash flow prediction · receivable age
Cash that arrives on terms needs no predicting. The work is in the $492,000 sitting past its date, which is where a month either slips or does not.
Ageing is measured from the invoice date. The three late buckets are what collections works, in that order.
Open receivable by age, Account 6624: 1 series across 4 buckets.
Cash flow prediction · the range
The twelve-month figure is $3.94M and the band is four per cent either side, so January lands between $3.78M and $4.10M. The width is published with the number, not produced when someone challenges it.
Four per cent is narrow by design, so the three lines sit close together. That is the width of the band rather than a rendering artefact.
Expected cash, August to January, with its band: rose from 2.7M at Aug to 3.9M at Jan across 6 points; range 2.7M to 3.9M.
Free up to $1M ARR. Your first forecast runs on day one.
